How to Read Open Interest in BANKNIFTY Options Like a Pro
Team MarketNetra
7 April 2026
BANKNIFTY moves differently from every other index in Indian markets.
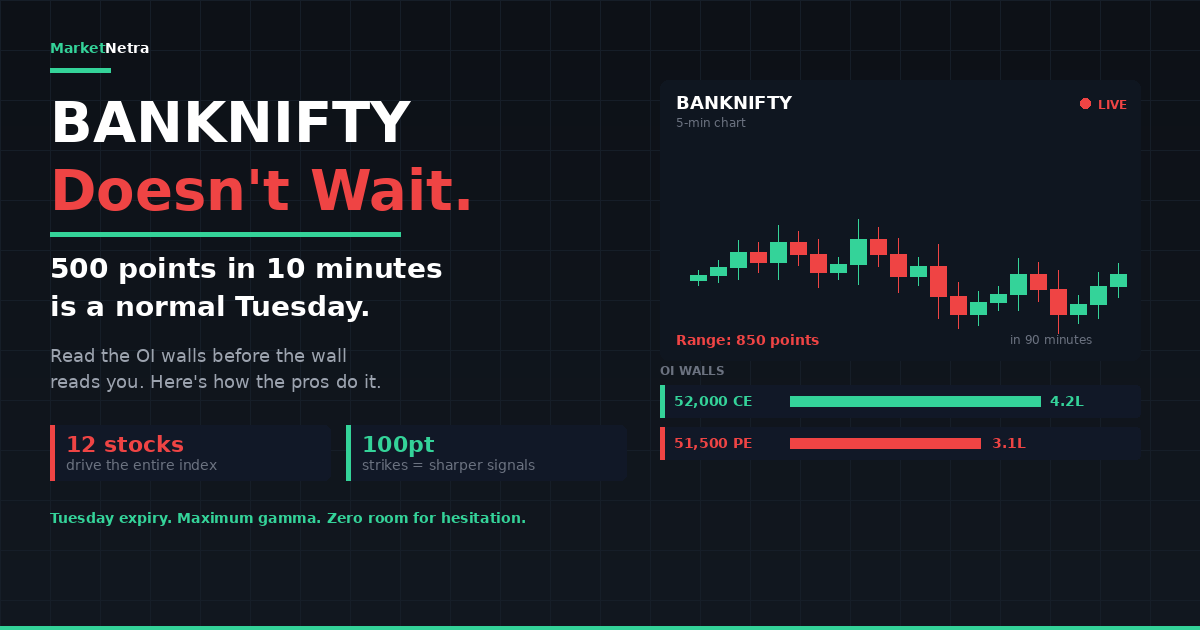
NIFTY drifts. BANKNIFTY whips. NIFTY's intraday range is typically 100–150 points on a calm day. BANKNIFTY can move 500–1,000 points in the same session — and 200-point swings in a single 15-minute candle are routine. This isn't volatility for the sake of drama. It's structure: BANKNIFTY tracks just 12 banking stocks, with HDFC Bank, ICICI Bank, and SBI alone accounting for nearly 50% of the index weight. When these heavyweights move, BANKNIFTY moves violently.
This is why reading open interest in BANKNIFTY options requires a different approach than NIFTY. The same OI data points exist — call OI, put OI, change in OI, PCR, max pain — but what they mean and how fast you need to react to them is fundamentally different.
If you trade BANKNIFTY weekly options without understanding how to read OI for it specifically, you're not trading. You're gambling with one of the most volatile derivatives contracts in Indian markets. SEBI's data shows that 91% of individual F&O traders lost money in FY24-25, and BANKNIFTY traders are disproportionately represented in those losses precisely because the speed of moves punishes anyone trading without proper positioning data.
Here's how the pros actually read it.
Why BANKNIFTY OI Behaves Differently
Three structural facts make BANKNIFTY OI analysis distinct from NIFTY.
Strike intervals are wider. BANKNIFTY strikes move in 100-point intervals (51,000, 51,100, 51,200) compared to NIFTY's 50-point intervals. This means each strike represents a bigger price move, and OI concentration tends to cluster more dramatically at fewer strikes. Where NIFTY might show meaningful OI across 8–10 strikes, BANKNIFTY OI is often concentrated at just 4–5 levels.
OI changes are more aggressive. Because BANKNIFTY moves faster, institutional traders adjust positions more frequently throughout the day. A NIFTY OI shift of 30,000 contracts in an hour might be considered significant. In BANKNIFTY, you'll regularly see 80,000–1,50,000 contract additions or unwindings within the same window. The signal-to-noise ratio is higher — but you have to watch more frequently to catch it.
Expiry day liquidity collapses faster. BANKNIFTY weekly expiry sees the most concentrated retail and institutional positioning of any Indian derivative. The OI data in the final 90 minutes is the most actionable signal in Indian markets — and also the most dangerous, as gamma effects amplify every move.
These three factors combine to make BANKNIFTY OI analysis both more rewarding and more demanding than NIFTY analysis.
The Three OI Signals That Pros Watch in BANKNIFTY
Beginners look at the highest call OI and highest put OI. Pros look at three deeper signals.
Signal 1: OI Concentration Ratio
This isn't a standard technical term — it's a practical concept that experienced BANKNIFTY traders use to assess the strength of resistance and support.
The OI concentration ratio is the difference between the highest OI strike and the second-highest OI strike on the same side (call or put). The bigger the gap, the stronger the level.
For example, if BANKNIFTY's highest call OI is 4.2 lakh contracts at 52,000 and the second-highest is 1.8 lakh at 52,100, the 52,000 level is genuinely strong resistance — institutional writers are concentrated there with conviction. But if the highest call OI is 2.5 lakh at 52,000 and the second-highest is 2.4 lakh at 52,100, the resistance is more diffuse and likely to be broken because positioning is spread across both levels.
In BANKNIFTY, because strikes are 100 points apart, this concentration matters more than in NIFTY. A 200-point move that takes out two adjacent strikes can happen in 10 minutes. A 200-point move that has to break through one heavily-defended single strike is much harder.
Signal 2: Asymmetric OI Buildup
In BANKNIFTY, the most actionable signal is when OI builds aggressively on only one side of the chain.
If you see call OI adding 80,000 contracts at 52,000–52,200 strikes while put OI is barely changing at 51,500–51,700, institutional bias is clearly bearish — they're building a ceiling without defending the floor. BANKNIFTY is more likely to drift toward the unprotected put strikes.
The opposite is equally telling. Heavy put writing at 51,500–51,700 with minimal call writing at higher strikes signals bullish institutional bias — they're building a floor and not concerned about the upside.
This asymmetry is harder to spot in NIFTY because positioning is more balanced across both sides. In BANKNIFTY, the asymmetry is sharper and the directional implication more reliable.
Signal 3: Intraday OI Velocity
BANKNIFTY OI changes faster than NIFTY, but the speed of change itself is the signal.
Slow, steady OI buildup throughout the day at a single strike means institutional positioning — they're accumulating with conviction. This level is likely to hold.
Sudden OI buildup of 50,000+ contracts in a 15-minute window at a single strike means an event reaction — typically institutional hedging against a news catalyst or a sharp price move. These levels are less reliable as long-term support/resistance because they were built reactively, not strategically.
The velocity reading takes practice. A useful rule: check BANKNIFTY OI at 9:30, 11:00, 12:30, and 2:00. If the highest OI strikes haven't changed positions across these checks, the levels are stable. If they're shifting every check, the market is repositioning aggressively and you should reduce position size.
The Six OI Patterns — But for BANKNIFTY
The standard six OI patterns (long buildup, short buildup, short covering, long unwinding, plus call/put writing patterns) apply to BANKNIFTY just as they do to NIFTY. But three of them work differently in practice because of the volatility.
Long buildup in BANKNIFTY (price rising + OI rising) is more meaningful than in NIFTY because BANKNIFTY moves are typically retail-driven on the way up. When you see institutional OI also building during an upmove, it's a stronger conviction signal than the same pattern in NIFTY. Institutions don't chase BANKNIFTY rallies casually.
Short covering in BANKNIFTY (price rising + OI falling at call strikes) produces violent upside moves. NIFTY short covering creates 100-point pops. BANKNIFTY short covering can create 500–700 point spikes within an hour. This is the single fastest profit-taking opportunity in Indian markets — but also the riskiest if you're on the wrong side.
Long unwinding in BANKNIFTY (price falling + OI falling) tends to cascade more than in NIFTY. Once long holders start exiting, the concentrated banking weights drag the index down hard. A "small" long unwinding signal in BANKNIFTY can precede a 400–500 point decline.
The pattern names are the same. The magnitudes are not.
PCR for BANKNIFTY: Different Thresholds
NIFTY PCR thresholds (above 1.2 bullish, below 0.7 bearish) don't translate directly to BANKNIFTY.
BANKNIFTY PCR runs structurally lower than NIFTY PCR because the index is more volatile and call writing is more aggressive. A "neutral" BANKNIFTY PCR is typically 0.7–1.0, not 0.8–1.2.
Practical thresholds for BANKNIFTY PCR:
| PCR Level | Signal | |-----------|--------| | Above 1.1 | Bullish lean — meaningful put writing | | 0.9 to 1.1 | Neutral | | 0.7 to 0.9 | Mild bearish lean | | Below 0.7 | Strong bearish lean | | Below 0.5 | Extreme bearish — often precedes a relief rally |
The single most important thing about BANKNIFTY PCR is to track its rate of change, not its absolute level. A PCR moving from 0.85 to 1.05 in two hours is a stronger bullish signal than a static PCR of 1.1 all day. The acceleration shows fresh institutional repositioning in real time.
Max Pain in BANKNIFTY: The Expiry Magnet
The max pain effect in BANKNIFTY is more pronounced than in NIFTY for one reason: the concentration of weekly volume in fewer strikes.
NIFTY weekly volume is distributed across 50-point strikes over a 600–700 point range. BANKNIFTY weekly volume concentrates on 100-point strikes within a 1,000–1,500 point range. This means the max pain calculation produces fewer "pull strikes," and the gravity toward those strikes in the final two trading days is stronger.
A pro-level BANKNIFTY trader watches for three things in the final 48 hours before expiry:
Day before expiry (Monday/Thursday): Where is max pain relative to current BANKNIFTY price? If it's within 200 points and the OI structure supports it (heavy put OI below max pain, heavy call OI above), the gravitational pull is strong.
Morning of expiry: Has max pain shifted from the previous close? A shift of 100+ points overnight indicates aggressive repositioning and weakens the predictive value.
Final 60 minutes: Does current price match max pain? In the last hour of BANKNIFTY weekly expiry, gamma effects collapse premiums rapidly, and the index typically gravitates toward max pain even if it was 300–400 points away at 2:00 PM.
This last hour is where most BANKNIFTY losses concentrate for retail buyers. Pros either exit positions or trade the gravitational drift toward max pain very carefully — but never blindly.
A Practical BANKNIFTY OI Reading Workflow
Here's the workflow professional BANKNIFTY options traders actually use.
9:00 AM (pre-open): Open the BANKNIFTY option chain. Identify the highest call OI strike and highest put OI strike. Note PCR. Note max pain. These four numbers are your structural map for the day.
9:30 AM (post-open settle): After the opening 15 minutes of chaos, check OI changes. Has anything material shifted from the pre-market reading?
11:00 AM: Second check. Has the support/resistance range tightened or expanded? Is OI building aggressively on one side?
12:30 PM: Lunchtime check. This is when many institutional desks reposition for the second half. Watch for sudden OI velocity spikes.
2:00 PM: Final structural check before the active afternoon session. By now the day's OI structure is mostly set.
Final 60 minutes on expiry day: Max pain gravity intensifies. Pros either close positions or trade with extreme size discipline.
This workflow takes about 2 minutes per check — assuming you can read the option chain quickly. Most traders cannot. They open NSE, see the wall of numbers, and either skip the analysis or do it superficially.
How AI Changes BANKNIFTY OI Reading
The challenge with BANKNIFTY OI isn't the concept. It's the speed. By the time you've manually checked OI, calculated changes from the previous reading, computed PCR, noted max pain, and synthesised the picture — BANKNIFTY may have already moved 200 points.
AI tools compress this entire workflow into a single query. Ask "what's the current OI structure for BANKNIFTY this expiry?" and you get the call/put walls, OI changes, PCR with rate-of-change context, max pain, and any unusual asymmetric buildup — all in 10 seconds.
The CFA Institute's November 2025 analysis noted that 97% of FPI profits in Indian markets come from algorithmic systems that process this kind of data in milliseconds. AI tools don't put retail traders on equal footing with institutional algorithms — but they meaningfully narrow the gap by removing the manual processing bottleneck.
What to Avoid in BANKNIFTY OI Trading
Don't trade expiry-day OI signals as if it's a normal day. The OI structure on the morning of expiry often reflects positions left over from the previous session and has limited predictive value until trading settles after 10 AM.
Don't ignore India VIX. BANKNIFTY moves correlate strongly with India VIX. High VIX means OI levels are more likely to be broken because volatility expands ranges. An OI reading without VIX context is incomplete.
Don't average OI signals across the day. BANKNIFTY positioning shifts rapidly. The 9:30 AM OI picture and the 1:30 PM picture might be entirely different. Always use the most recent reading for decisions.
Don't trade the final 60 minutes on OI signals alone. The closing hour is dominated by gamma and time decay, not OI structure. OI is one input here, not the primary one.
The Bottom Line
BANKNIFTY is the most traded, most volatile, and most punishing weekly options contract in Indian markets. Reading OI for it isn't optional — it's the difference between trading with structural awareness and trading blind.
The same six OI patterns from NIFTY apply, but the magnitudes are larger, the speed is faster, and the levels matter more because BANKNIFTY tests them constantly throughout the session.
Pros don't read BANKNIFTY OI once a day. They check it multiple times, watch for asymmetric buildup, track velocity, and use max pain as an expiry-day framework. The retail traders losing 91% of the time skip all of this — they trade BANKNIFTY weekly options on intuition and chart patterns alone.
The OI data is free. NSE publishes it every few seconds. The only thing that separates pros from the losing 91% is whether they read it, understand it, and act on it fast enough.
MarketNetra reads the BANKNIFTY option chain in real time — OI walls, asymmetric buildup, PCR shifts, max pain — synthesised in plain English. No more tab-switching while BANKNIFTY moves 300 points.
Sources
- SEBI Study (July 2025) — 91% of individual traders lost money in F&O in FY24-25; net losses of ₹1,05,603 crore. sebi.gov.in
- CFA Institute Market Integrity Insights (November 2025) — 97% of FPI profits from algorithmic trading. blogs.cfainstitute.org
- PL Capital (2025-26) — Bank Nifty Option Chain Analysis: Live OI Data Interpretation. plindia.com
- 5paisa (2026) — Bank Nifty live OI data interpretation. 5paisa.com
- NSE India — Live BANKNIFTY option chain data; lot size 30, weekly expiry. nseindia.com
Ready to trade smarter?
Get AI-powered market analysis for NIFTY, BANKNIFTY, and 200+ F&O stocks.
Start for ₹1 →