How to Use AI for Option Chain Analysis in Indian Markets
Team MarketNetra
4 April 2026
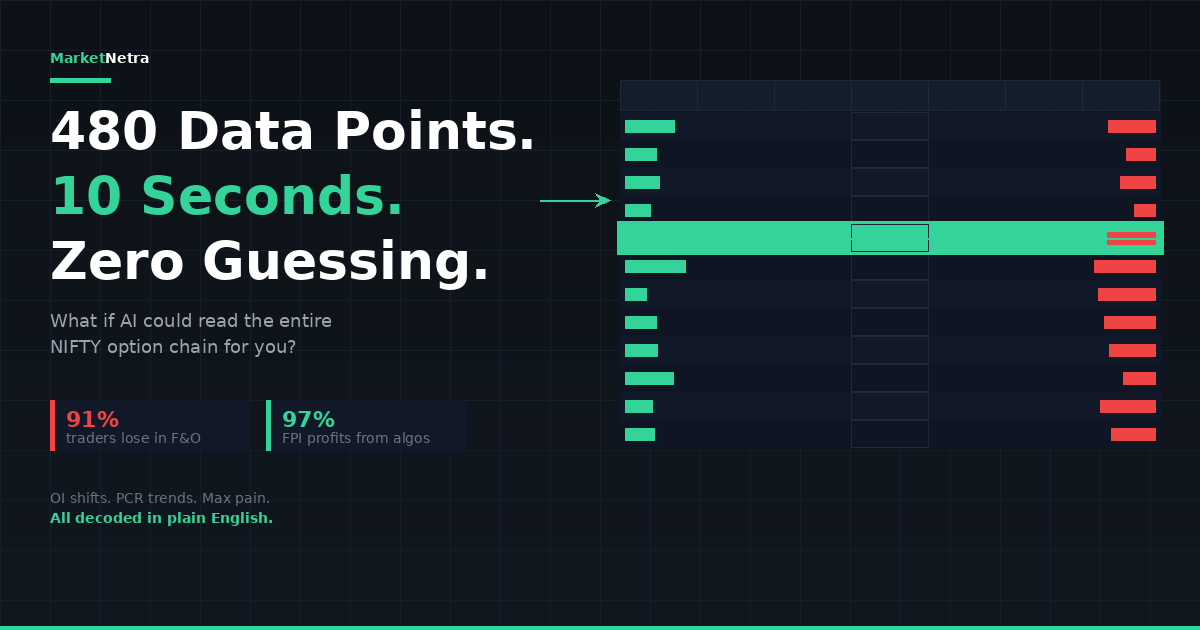
Open the NIFTY option chain on the NSE website right now. You'll see a wall of numbers — 40+ strike prices, each with six columns of data, for both calls and puts. That's roughly 480 data points staring back at you, updating every few seconds. Now multiply that by the fact that you need to track changes over time, compare OI shifts across strikes, correlate them with FII/DII activity, cross-reference with India VIX, and somehow arrive at a trading decision before the setup disappears.
This is where most retail traders fail — not because they don't understand what the option chain shows, but because they can't process it fast enough to act on it. SEBI's July 2025 study confirmed what many suspected: 91% of individual F&O traders lost money in FY2024-25, with collective losses hitting ₹1.06 lakh crore. Meanwhile, 97% of FPI profits came from algorithmic trading systems that process exactly this kind of multi-dimensional data in milliseconds.
AI trading intelligence doesn't replace option chain analysis. It makes it humanly possible to do well.
What Traditional Option Chain Analysis Gets Right (And Where It Breaks Down)
The fundamentals of option chain reading are well-established. The strike with the highest call OI typically acts as resistance. The strike with the highest put OI suggests support. Rising OI alongside rising prices signals long buildup (bullish). Rising OI with falling prices signals short buildup (bearish). Falling OI with rising prices means short covering. Falling OI with falling prices means long unwinding.
These six patterns are the bread and butter of every F&O trader in India. They work. The problem isn't the framework — it's the execution.
Here's what actually happens in practice: you open the NSE option chain at 9:15 AM. NIFTY is at 23,400. You see heavy call OI at 23,500 and heavy put OI at 23,200. Range identified: 23,200 to 23,500. You plan accordingly.
By 10:30 AM, 23,500 call OI has dropped by 15,000 contracts while 23,600 call OI has jumped by 22,000 contracts. Meanwhile, put OI at 23,200 has barely changed but a fresh 18,000 put contracts have appeared at 23,300. India VIX ticked up by 3%. PCR shifted from 1.05 to 0.89.
What does this mean? Is the resistance shifting up (bullish) or are call writers repositioning because they expect a breakdown? Is the new put OI at 23,300 hedging or fresh selling? The individual data points are clear. The synthesis is where humans struggle — especially when they're already in a position and their emotional brain is doing the interpreting.
This is the precise gap AI fills.
How AI Transforms Option Chain Analysis: The Five Layers
Layer 1: Instant OI Landscape Synthesis
The most basic and most valuable thing AI does with option chain data is compress the entire picture into a readable narrative. Instead of scanning 40 strikes and mentally comparing call OI versus put OI, you ask a single question and get a synthesised answer.
The traditional approach requires you to open the NSE chain, scan from ITM to OTM, mentally note the highest OI strikes, calculate PCR by adding put OI and dividing by call OI, compare today's OI with yesterday's, and form a view. This process takes 5–10 minutes if you're experienced, and by the time you're done, the data may have already shifted.
With an AI intelligence tool, you ask something like "Where is the OI buildup heaviest for NIFTY this week?" and get an immediate answer that identifies key support and resistance levels, tells you whether the setup is range-bound or directional, flags any unusual activity at specific strikes, and puts the current PCR in context of recent trends.
The time savings alone are significant. But the real value is consistency — you get the same thorough analysis whether you're calm at 9 AM or panicking at 2:45 PM with an open position going against you.
Layer 2: Change-in-OI Pattern Detection
Static OI tells you where positions exist. Change-in-OI tells you where positions are being built or unwound right now. This is far more actionable, but also far harder to track manually.
An AI tool can monitor OI changes across all strikes simultaneously and flag patterns as they form — long buildup at specific calls, short covering at certain puts, unusual additions in deep OTM strikes that might signal institutional hedging activity.
Research on NSE option chain data has examined the relationship between OI changes and subsequent price movement. A study published on SSRN found that open interest data in Nifty index options does carry predictive information about the underlying's direction, particularly when analysed through changes rather than absolute levels.
The challenge for a human trader is that OI changes happen across dozens of strikes every few minutes. You can't watch them all. AI can — and more importantly, it can distinguish between noise (small, scattered OI changes) and signal (concentrated, large OI shifts at specific strikes that align with volume confirmation).
Layer 3: Multi-Signal Confluence
This is where AI option chain analysis becomes genuinely powerful — and where it goes beyond what any spreadsheet or single tool can replicate.
Option chain data doesn't exist in a vacuum. A heavy call OI buildup at 24,000 means something very different depending on:
- Whether FIIs were net buyers or sellers that day
- Whether India VIX is at 12 (calm) or 22 (nervous)
- Whether sector rotation is favouring banking (35% of NIFTY's weight)
- Whether PCR is trending up or down over the past three sessions
AI tools synthesise all these signals simultaneously. When you ask "NIFTY has heavy call OI at 24,000 but FIIs sold ₹3,000 crore today — is this resistance real?" the AI cross-references option chain positioning with institutional flow data, volatility context, and technical structure to give you a probability-weighted assessment — not just a single data point.
This multi-signal confluence is what institutional desks have always had — teams of analysts monitoring different data feeds and synthesising them in real time. AI brings a version of this capability to a solo trader sitting at home.
Layer 4: Max Pain and Expiry Day Context
Max pain — the price at which the maximum number of option buyers expire worthless — is one of the most searched option chain concepts among Indian traders. And for good reason: NIFTY does tend to gravitate toward max pain as expiry approaches, particularly in the final two days.
But max pain alone is a blunt tool. It doesn't tell you whether current positioning supports a move toward max pain or away from it. It doesn't account for sudden OI changes on expiry day that can shift max pain itself.
AI tools contextualise max pain within the broader picture. Instead of simply telling you "max pain is at 23,800," an AI can tell you:
Max pain is at 23,800. Current NIFTY is at 23,650. Put OI at 23,600 is strong enough to support the move toward max pain. There's fresh 25,000-lot call writing at 23,900 suggesting limited upside. Historically NIFTY has settled within 0.5% of max pain 62% of the time in the last 12 weekly expiries.
This contextual richness is the difference between a data point and an insight.
Layer 5: Natural Language Querying
This might sound like a convenience feature, but it's actually transformative for how retail traders interact with option chain data.
Traditional analysis requires you to know where to look, what to look for, and how to interpret what you find. AI intelligence tools let you ask questions in plain English, in the way you actually think about the market:
- "BANKNIFTY has been stuck between 52,000 and 52,500 for two days — what does the option chain say about a breakout?"
- "I'm thinking of selling the 24,000 CE. Where is the risk?"
- "FIIs sold heavily yesterday but NIFTY didn't fall. What's the option chain saying about support?"
Each of these questions would take an experienced trader 10–15 minutes to answer manually, requiring multiple data sources. An AI intelligence tool synthesises the answer in seconds.
A Practical Workflow: AI-Assisted Option Chain Analysis
8:55 AM — Pre-market OI snapshot: Ask your AI tool for overnight OI changes. What strikes saw the biggest additions? Has the support/resistance range shifted from yesterday? This takes 30 seconds and replaces 10 minutes of manual scanning.
9:15–9:30 AM — Opening range context: The first 15 minutes are chaotic. Don't try to read the option chain manually during this period. Let the opening range establish itself, then ask the AI "What does the OI change in the first 15 minutes tell us?" Fresh OI in the first 30 minutes often reveals institutional positioning for the day.
Before entering a trade — Sanity check: Before you buy or sell any option, ask the AI to validate your thesis against the option chain. "I want to buy NIFTY 24,000 CE. What does the OI picture say?" This 15-second check has saved more traders from bad entries than any indicator ever has.
During the trade — Shift detection: Instead of staring at the option chain refreshing, ask the AI every 30–60 minutes whether the OI structure has changed materially. Is your support still holding? Has resistance shifted?
2:30 PM onwards — Expiry positioning (on expiry days): The last 90 minutes of expiry day are when max pain, OI shifts, and gamma effects collide. This is the single most dangerous period for manual analysis because speed matters and emotions run highest. AI gives you a real-time read without the emotional distortion.
What AI Cannot Do With Option Chain Data
AI cannot predict which direction the OI-based support or resistance will break. It can tell you where the walls are, but markets break walls regularly.
AI cannot account for sudden exogenous events. A geopolitical escalation, an unexpected RBI decision, or a global market crash will override any option chain positioning instantly. OI data is backward-looking by nature.
AI tools are intelligence layers, not trading systems. They make your analysis faster and more thorough, but they don't make your risk management decisions for you. Position sizing, stop-losses, and capital allocation remain entirely your responsibility.
The Competitive Edge: Why This Matters Now
The CFA Institute's November 2025 analysis highlighted a critical point: institutional investors benefit from sophisticated algorithmic systems that execute in milliseconds, and this technological edge could widen further as AI tools continue to evolve.
This is the asymmetry that AI intelligence tools address. Not by giving you the same algorithmic trading systems — that's a different game entirely — but by giving you the same analytical depth. When a retail trader can synthesise OI changes, FII flows, PCR shifts, max pain positioning, and technical levels as fast as an institutional analyst can, the information gap narrows meaningfully.
The option chain data itself is freely available on NSE's website. It updates every few seconds. The edge was never about access to data. It's about speed and quality of interpretation.
The wall of 480 numbers that seemed impenetrable at the start of this article? With AI, it becomes a conversation: "What's the option chain telling me right now?"
That's not the future of option chain analysis. It's already here.
Sources & Citations
- SEBI Study (July 2025) — 91% of individual traders lost money in FY24-25; net losses of ₹1,05,603 crore.
- CFA Institute Market Integrity Insights (November 2025) — 97% of FPI profits from algorithmic trading; institutional technology advantage widening.
- SSRN Research — Srinivas & Bhattacharyya, "Nifty Index Options: Open Interest Analysis of Options Chain" — validates predictive power of OI changes.
- Moneylife (December 2025) — ₹1.06L crore lost by individual F&O traders confirmed in Parliament.
For educational purposes only. Not SEBI-registered investment advice.
Ready to trade smarter?
Get AI-powered market analysis for NIFTY, BANKNIFTY, and 200+ F&O stocks.
Start for ₹1 →